[Update]
I’ve written an updated post for Mac and Excel 2011 users.
[Update2]
From Leanne in the comments:
Some useful remark I found elsewhere: “You can put the graph as a separate document tab (opposed to inside a sheet)”. If you then follow the same steps i.e. save as PDF, then you don’t have to do the things with the margins.
—-
For the evaluation part of my thesis I had to include a lot of charts. The scientific approach proably would have been to use gnuplot, but my tool of choice for any kind of charts is Microsoft Excel 2007. However, I found no simple and easy way to directly include Excel charts into my LaTeX thesis document. After a lot of experimenting and looking at other people’s solutions I came up with the following:
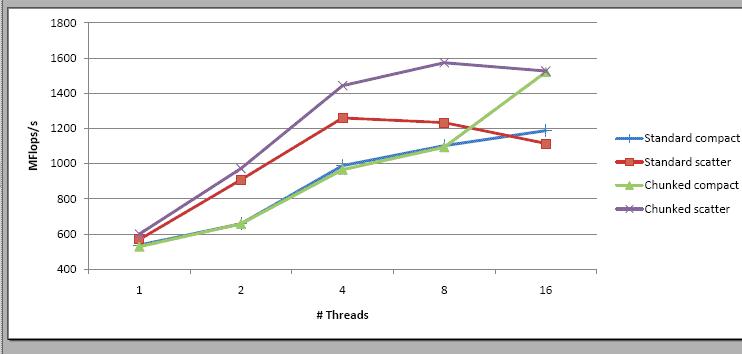
1. Create chart in Excel as usual
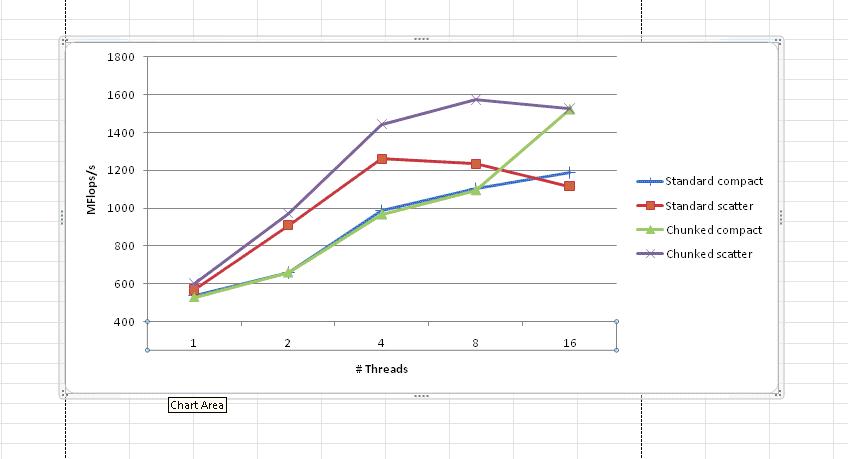
2. Select chart:
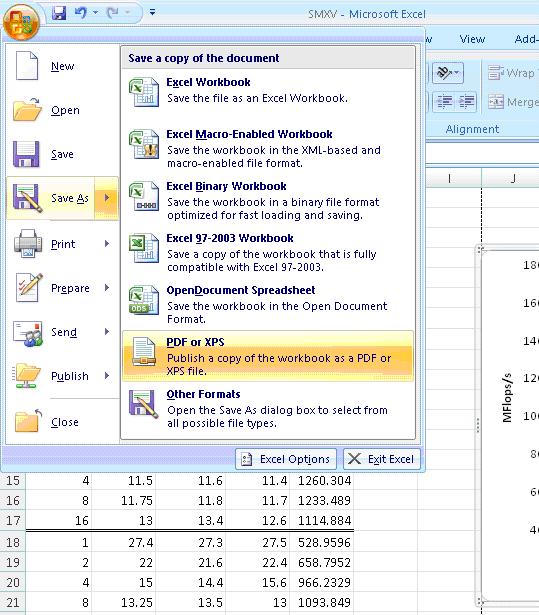
3. Save As : PDF
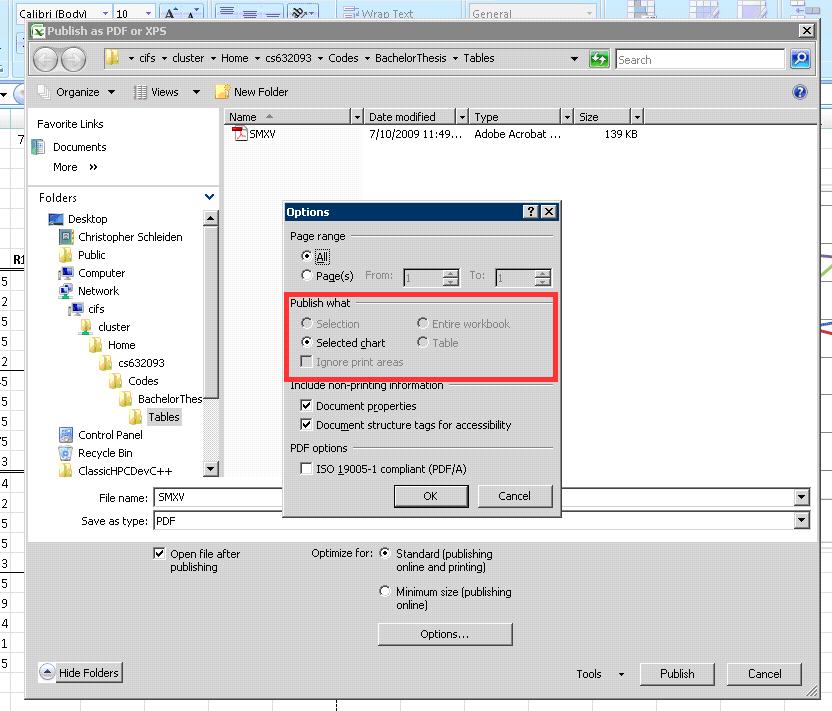
4. Choose to publish only selected chart:
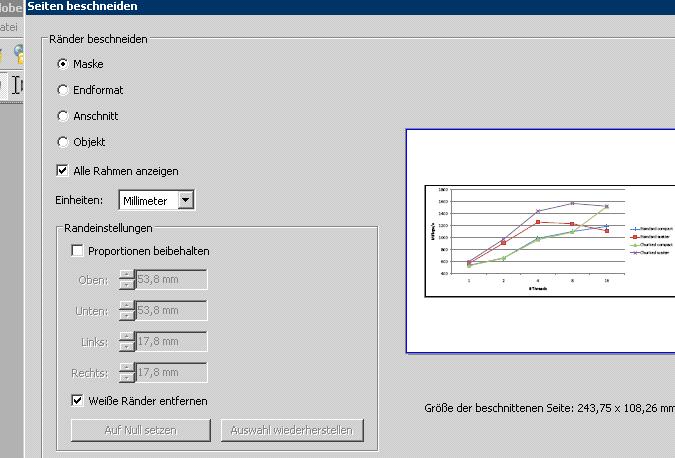
5. Use Acrobat Professional (or similar) to trim white borders around chat (can also be done in LaTeX through margins, but this way it’s easier and less work to embed the chart):
6. Save:
7. Embed:
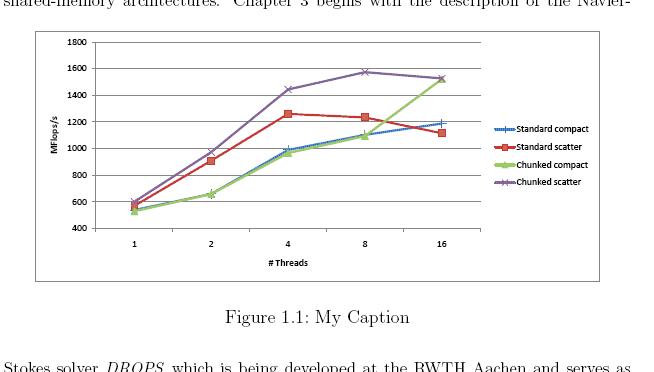
8. Result:
Scaling (in LaTeX) to 50%:
9: Done
[Update 13/08/2011]
I’m again writing a thesis and this time I’m using OS X and apparently with Microsoft Excel 2011 for Mac you do not need to specifically crop the resulting pdf as the screenshot above shows. Just select “Save as picture” from the diagram context menu and select pdf. Pleasant surprise as I don’t have access to Acrobat Pro anymore (I was also told that the “pdfcrop” utility works just as well, but one step less is always good).



How do you go about the bounding box error?
When I try the above I just get:
‘Cannot determine size of graphic in image.pdf (No bounding box)
Uh. I didn’t get any errors like this. I’ve used the latex Miktex and TexLive distributions and everything worked just fine.
Are you sure you are using the graphicx package? try adding the [hiresbb] option.
I dont see this pdf/xdf option in my save as menu! did you install something more?
I am doing my thesis and ran into the same problem. Gnuplot was driving me crazy. Your post is perfect. If you ever need stacked and clustered charts, try out this from another thesis writer.
http://www.burningcutlery.com/derek/bargraph/
I had try a steps like above..and i got the error such
! Undefined control sequence.
l.8 \includegraphics
[width=0.90\textwidth]{charts/smxv.pdf}
?
Process interrupted by user
i had save my graph in excel in pdf format and use a command below usingTexlive
\documentclass[a5paper]{article}
\usepackage[english]{babel}
\begin{document}
\section{who is}
\begin{figure}[htbp]
\centering
\includegraphics[width=0.90\textwidth]{charts/smxv.pdf}
\caption{figure 1}
\label{step}
\end{figure}
\end{document}
thanks. It will put a plus in my dissertation! Thaks a lot!
To get my charts out of excel I copy the chart and paste it into word, then right click on it in word and I can save it as a png file.
Some useful remark I found elsewhere: “You can put the graph as a seperate document tab (opposed to inside a sheet)”. If you then follow the same steps i.e. save as PDF, then you don’t have to do the things with the margins.
I tried to put the graph in a separate tab, but I still get some margins in the pdf which mess up the output in Lyx. Maybe I miss something there?
Thank you Lanne, you are the real MVP! (not sure if your read this thou)
I don’t get a PDF or XPS option in “Save as…”?!
you have to choose “Export” instead of “Save as”
Diagram context menu? Where specifically can I find that option?
Excelent post. Thanks a lot!